Free help: USER GUIDE
Home > Clients & Profits X User Guide > My > Client Statistics

|
Clients & Profits X Online User Guide |
While Clients & Profits X keeps track of each client's billings forever, the Client Statistics window conveniently graphs the last two years billings.
The Stats window is a great place for account
people and agency principals to see a snapshot of a client’s
billing.
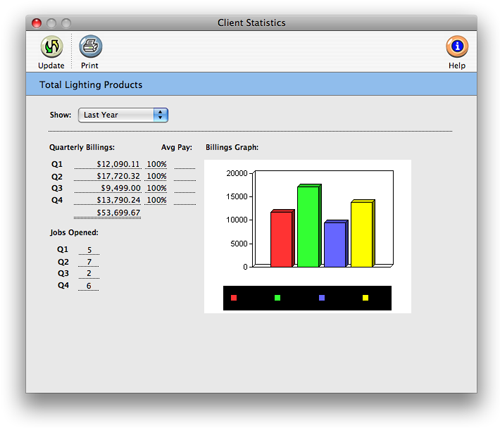
The Client Statistics window
shows the billings by quarter, using invoice totals posted in Accounts Receivable.
For each quarter you’ll see the total billings, the percent of total billings,
and the average payment information.
The Client Statistics window and the report don’t show the client’s
profitability, so are relatively safe to show to clients and agency staff members.
The quarterly billings amount is the sum of the invoices for the three
periods that make up each quarter.
The percent field lets you easily see trends in each client’s billing.
It can help you see the highs and lows for each client, helping you better
plan next year’s budget and cash flow.
The avg pay number counts the number of days the client needed to pay
off each invoice added during the quarter. You can use this information to
analyze how quickly or how slowly a client is paying their invoices from quarter
to quarter. It’s a great way to spot clients whose payments are slowing
down--a sure danger sign that the account is in trouble.
The total number of jobs opened during each quarter are shown for comparison.
The ratio of jobs opened to total billings can provide an interesting insight
into the client’s work from quarter to quarter (i.e., more jobs with the
same billings means those jobs were smaller, etc.).
To see this year’s client statistics
1 Choose My > My Clients.
2 Find the client whose statistics you need to review
3 Click on the Stats button,
or choose Edit > Account Statistics.
The Client Statistics window opens. The quarterly billings aren’t shown
until the Update Graph button is clicked, since updating the totals can be
time-consuming.
4 Click the Update Graph button to calculate the year’s
total billings, average payments, and percent of total billings
for this client.
To see last year’s statistics
1 Choose Last Year from the Show pop-up menu.
Last year’s totals will be calculated auto-matically (there’s no
need to click the Update Graph button), and the graph will be redrawn.
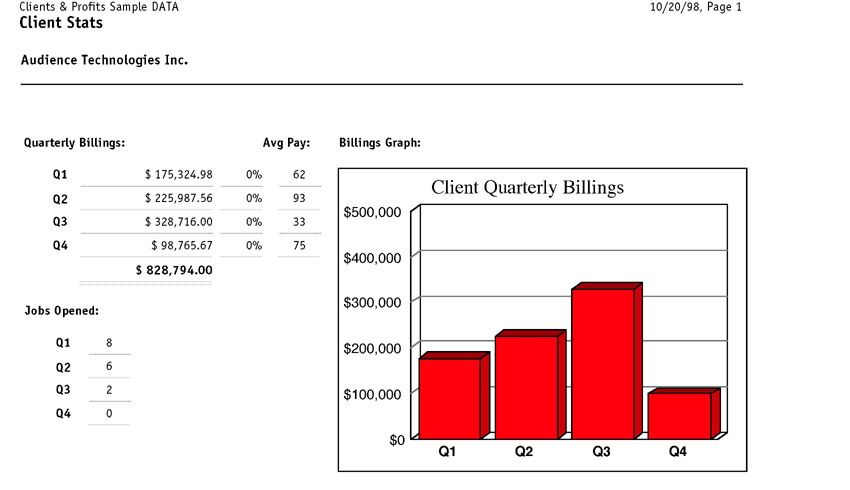
To print the client statistics graph
1 Click the print button.
Billing graphs. The Billings Graph can be printed in color using a color inkjet or laser printer. The graph can also be printed to screen, copied into the computer's Clipboard, then pasted into a word processing or spreadsheet document for reporting purposes. |