Free help: USER GUIDE
Home > Clients & Profits X User Guide > My > CR Basics

|
Clients & Profits X Online User Guide |
The Custom Report writer offers Clients & Profits X users a quick (and relatively easy) way to create simple client lists, job lists, cost reports, and accounting export files.
Custom reports are completely customizable (within
reasonable limits) and can access any part of the database.
Custom reports select, sort, and display data from your Clients & Profits
X database. This data can be printed to the window for a quick review, to the
printer for a hard copy, or export to disk to be used by spreadsheets or word
processors. A custom report is a stand-alone document that contains the report’s
design, its fields, any queries, and settings that determine how the data is
sorted and sub-totaled.
Custom reports don’t replace the reports built into Clients & Profits
X; instead, they supplement them by letting you see data from different fields.
They have limitations since they aren’t programmable (for example, you
can’t age accounts automatically before printing a custom client aging
report). Custom reports are best suited for showing information that’s
already available from other built-in reports. The advantage to custom reports
is in their flexibility: you can decide which fields to show or hide, as well
as the how the records are selected. These features give you the ability to
see beyond what the standard reports offer.
Customize Reports Toolbox |
|
| There are many tools available to help you customize your reports, including text, line, and drawing tools, as well as a custom color picker. You can also customize the typeface for individual sections of a report using the typeface style and size tools. | |
| Text
Tool Use this tool to activate the text cursor, which will allow you to edit text in the reports header, records, and total labels. |
|
| Line
Tool Quickly and easily creates individual lines. Click where you want the line to begin, and drag where you want the line to end. |
|
| Rectangle,
Rounded-Rectangle, and Ellipse Tools Let's you draw rectangles (including squares) and ellipses (including circles) by dragging from one corner of the rectangle or edge of the ellipse to the opposite corner or edge. |
|
| Typeface,
Style, and Size menus Use the Type pull-down menu to apply any font in your system to your report. You can choose the type size in the Size submenu, and apply various styles such as plain, bold, italic, underline, shadow, or outline. |
|
| Color
Picker Use the Color Picker to select the type or line color by choosing from the color palete. In addition, you can use the color mixer to fine tune the color to your liking. |
|
Custom reports are based on
templates Every custom report gets its basic
design and layout from a report template. The
report template is like a style sheet that determines
where fields, sections, headings, and subtotals
appear on the page. For consistency, the template
designs look like the built-in reports printed
from Clients & Profits X.
When you create a new custom report, you'll base it on one of the report template
designs. This saves time, since you only need to focus on the content of the
custom report--and not the technical make-up of the report.
The Report Templates file (named TEMPLATE.REP in Windows) contains basic layouts
for six different custom reports:
List w/1 sub-total
List w/2 sub-totals
List w/3-sub-totals
Labels (1" x 2 5/6")
Labels (2" x 4")
Spreadsheet file
You can change the position of fields and labels on a custom report. However, you can't rearrange the sections; these are part of the report template.
The Report Templates file must be stored next to the Clients & Profits X application; otherwise, you'll get an error when trying to create a new report.
Custom reports are based on sections
Sections are used to display fields on custom reports, including:
Page heading: Fields, labels (the report title, the date and page number), and graphics appear at the top of every printed page.
Sub-total heading: Fields and labels appear once each time a record is subtotaled.
Record: This is the body of the custom report, and typically contains most of the report’s fields. The record section prints one line for every record you’ve selected.
Sub-total: This section appears whenever records are sub-totaled, after a record section.
Total: The total section appears at the end of the report.
Sections are copied from the template. You can control where they appear on the page by moving them with your mouse.
Adding fields
New fields can be added to a custom report anytime, as needed. They are added from the Fields/Queries window.
1 From the custom report window, click on the Fields/Queries button.
2 Choose Add Fields from the Field pop-up menu by right-clicking (if you're using a PC), or pressing the Control key while holding your mouse button down (if you're using a Mac).
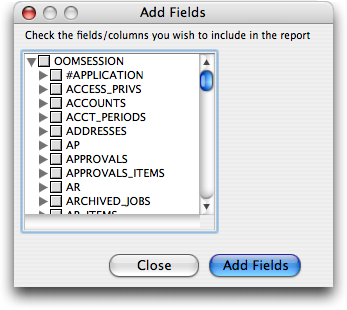
The Add Fields window lists the various files and their fields.
3 Click once on the grey arrow to show all available data files. To include all fields in a data file, click the checkbox next to that data file. To only include selected fields, click once on the grey arrow next to the data file, then click the checkboxes next to the fields you wish to add.
4 When you are finished adding fields to your new report click the Add Fields button, then click Close.
The field and a column headings are added to the custom report. Once a field is added, you can sort it with the other fields. Or, you can define a query using the field’s value.
Selecting records
Data is selected for printing on custom reports using queries. Queries define how the database is to be searched when the report is printed. These searches are flexible enough to let you find any record in the database relatively quickly. Queries can be modified as needed. Any field on the report can be used as a query.
1 From the custom report window, click on the Fields/Queries button.
2 Click on a field to select it.
3 Right-click (on a PC) or hold the control key while clicking (on a Mac) and choose Add To Query from the pop-up menu.
The way in which you compose the query is important -- and is somewhat technical. Queries can be simple or complex, with several fields and conditions. The query operator determines how the records are found. The standard queries, such as equal to and greater than are simple to use. For example, you can find all jobs for one client by adding the client number (i.e., J_CLIENT_NUM) to the report then adding the query: J_CLIENT_NUM = 'ABC'. When the report is printed, only jobs for client ABC will be listed.
4 Click on the check mark to accept this query.
Sorting
Any field on your custom report can be sorted. Sorts can be simple or complex, depending on the fields on the report. For example, a job list can be sorted by job number by sorting the J_NUM field; a complex, multi-level sort might sort a job list by J_CLIENT_NUM, J_PROD_ STATUS, and J_NUM (i.e., client number, production status, job number). Up to nine fields can be sorted on a custom report.
1 From the custom report window, click on the Fields/Queries button.
2 Click on a field to select it.
3 Select the checkbox in the sort coloumn to select the field for sorting. The first field selected for sorting will be sorted first, the second field selected will be sorted second, etc.

You can add a second sort to the report by selecting a field, then choosing Sort Last. A number “2” appears next to the field. Other fields can be sorted as well by selecting a field then choosing Sort Last or Sort First accordingly.
Fine-tuning the report’s design
A report’s graphic elements, like lines, colors, circles, and fonts, are changed in the Design window.
1 From the custom report window, click on the modify button.
A what-you-see-is-what-you-get window opens, showing the report’s design. Fields are listed by field name within each section. A report is composed of different sections, such as the Record section, Page Heading, and Total section. These sections determine how the data appears on the report.
You can add labels, text, lines, borders, boxes, and other graphics to the report using the toolbar at the top of the window. If you do not see the toolbar immediately, click on the arrow button at the top right of the window to display the toolbar menu.
2 Make your changes.
3 To save your report, use your mouse to right click (or press control and click) and choose Save from the drop-down menu. Name your report, and click Save.
Learn more:
Custom Reports FAQ
Custom
Reports Tips Tech Note
Making custom reports
Working with data files
The C&P file structure
Modifying custom reports
Selected records with queries
Exporting data with custom reports