Free help: USER GUIDE
Home > Clients & Profits X User Guide > Snapshots > Financials

|
Clients & Profits X Online User Guide |
Clients & Profits X prints standard financial
statements tailored especially for the advertising
industry. These financial reports are used for
auditing, tracking, and reporting your G/L accounts
balances. You can print trial balances, income
statements, balance sheets, and detailed general
ledger reports for any accounting period -- at
any time during the month.
Financial statements show account balances from the General Ledger and the
Chart of Accounts. These account balances are updated when entries are posted,
so the financial statements are always timely and accurate whenever they’re
printed.
The account totals on the financial statements are copied from the Chart of
Accounts. To see one account’s totals: Choose Setup > Chart of Accounts.
Click once on an account to select it, then choose Edit > Monthly Budgets.
The center column, actuals, is the total from posted entries. Entries added
in the General Ledger affect financial statements when they’re posted.
Unposted entries won’t appear on financial reports. Be sure to post everything
before printing financial statements.
There
is no month-end procedure required to print financials. Since the
G/L account balances are updated whenever entries are posted, your
financial statements will always be up-to-date throughout the month.
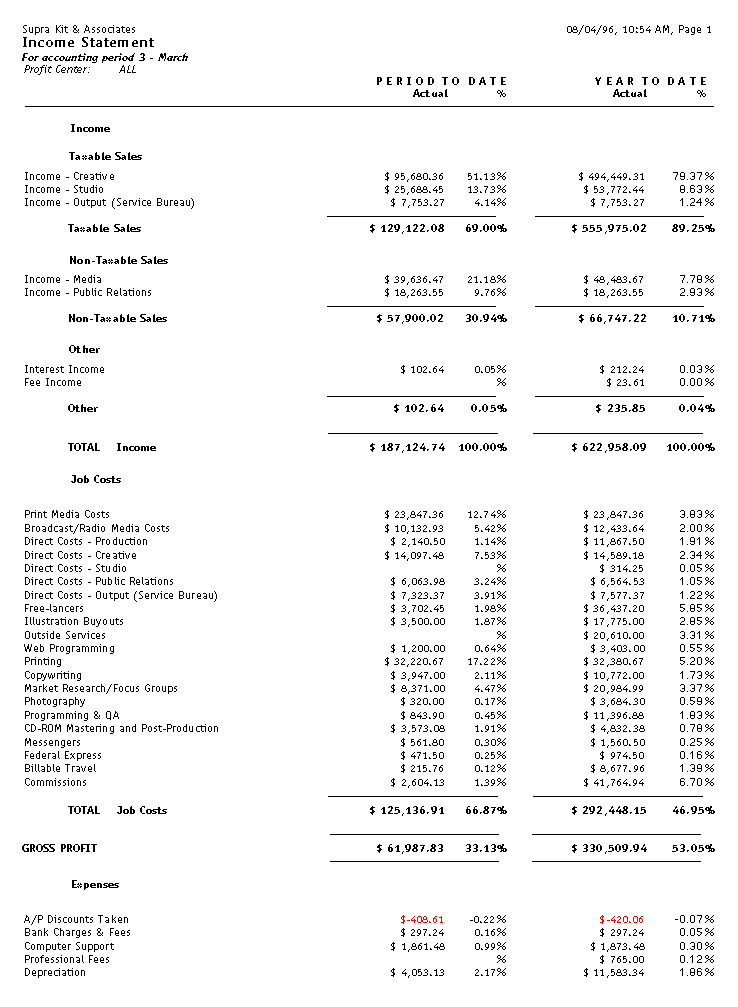
The AGI Income Statement
The income statement shows the agency’s profit and loss. There are two kinds of income statements, the standard form and the agency gross income form. Both forms show the same accounts, but have different sub-totals. These sub-totals affect how the percentages are calculated.
The standard income statement sub-totals income accounts, job cost accounts, and expense accounts. Gross profit is calculated as billings minus job costs. A gross profit percentage is calculated showing job costs as a fraction of the total billings. An account can appear in the income or job cost section, based on its classification (which is user-defined). Expenses are listed below the gross profit. The expense percentage for each overhead account is calculated as a percent of the billings, not gross profit. This calculation shows your ratio of overhead to total billings.
The AGI
income statement combines your billing and
job cost accounts into the same section. The
gross profit is calculated as the billings minus
job costs (like media, typesetting, printing,
etc.). This amount is your agency gross income.
Expenses are listed below the AGI. The expense
percentage for each overhead account is calculated
as a percent of gross profit, not billings. This
calculation shows the ratio of overhead to gross
profit -- the agency’s gross income.
To print financials
1 Choose Financials from the Snapshot menu.
The Financials snapshot window opens.
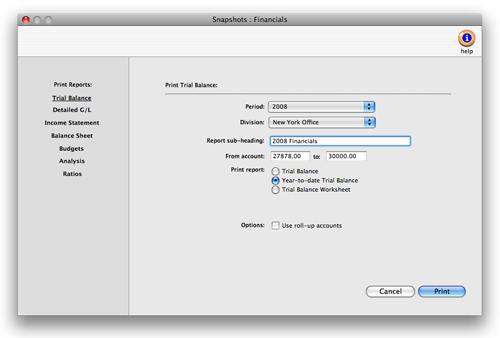
2 Select the kind of report (i.e., Trial Balance, Detail G/L, Income
Statement, etc.)
3 Make your report selection.
4 Click Print.
Tips for printing financials
Financial reports can be printed to the screen for quick review, before the report is committed to paper.
Financial statements can be printed for previous periods -- even if the period is locked -- by choosing the period from the pop-up menu.
Unless a period is locked, anyone can post entries into prior periods. This means your past financials might change after they’ve been printed. If someone adds costs or billings after you’ve printed the month’s financials, be sure to reprint the reports over again.
Account totals on financial statements can be audited by printing audit trails and journals from the General Ledger.
Income Statements and Balance Sheets can be printed for selected profit centers.
If your audit trails and journals don’t equal the financial statements, posting may have crashed during the month. Use the verify G/L account balances utility to recover the correct totals.
The date and time a financial statement was printed appears at the top of each report. When you’re printing financial reports repeatedly, use this date to determine the most-recently printed report.
Financial Statements |
|
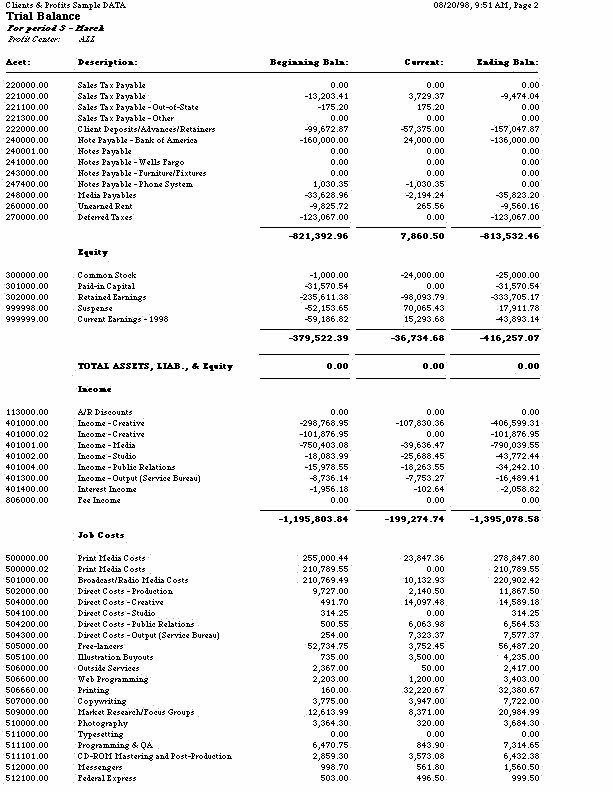
Trial Balance |
|
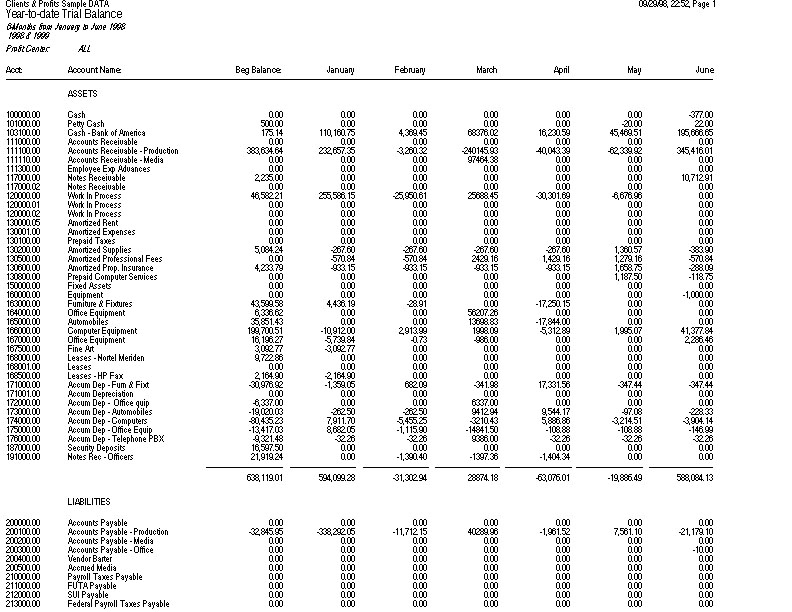
The Trial Balance shows assets, liabilities, equity, income, costs, and expenses. You’ll see each account’s beginning balance, current balance, and ending balance. Assets, costs, and expenses have positive balances; liability, equity, and income accounts have negative balances. |
|
The Year-to-Date Trial Balance report shows balances for each accounting period for assets, liabilities, equity, income, job costs, and expenses -- for the entire year. The report is split into two sections: the first six months and the last six months. |
|
The Trial Balance Worksheet shows each account’s current and ending balance plus two blank columns, so the printed report can be used as a worksheet to calculate adjustment and adjusted balance amounts. |
|
Detailed G/L |
|
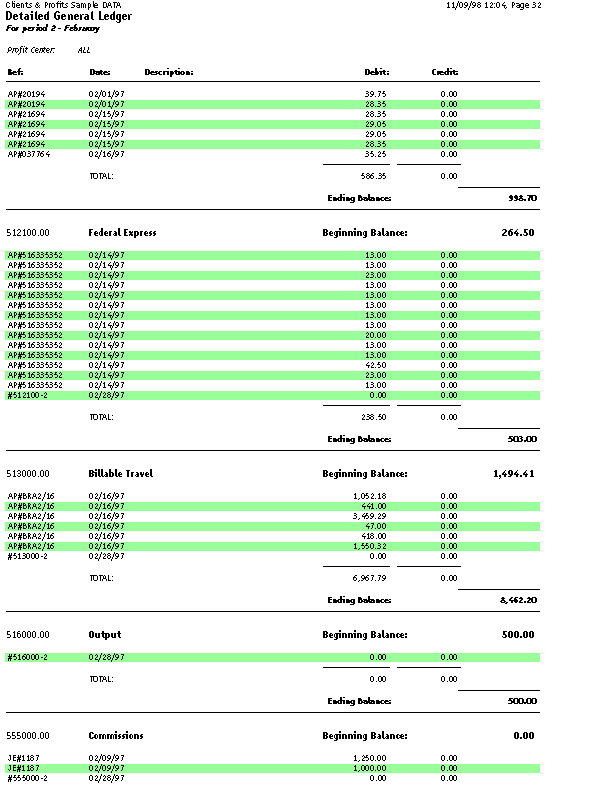
The Detailed General Ledger report shows the period’s journal entries for each account. Each account includes its beginning and ending balances for quick reference. For easy auditing, journal entries can be printed for selected accounts. |
|
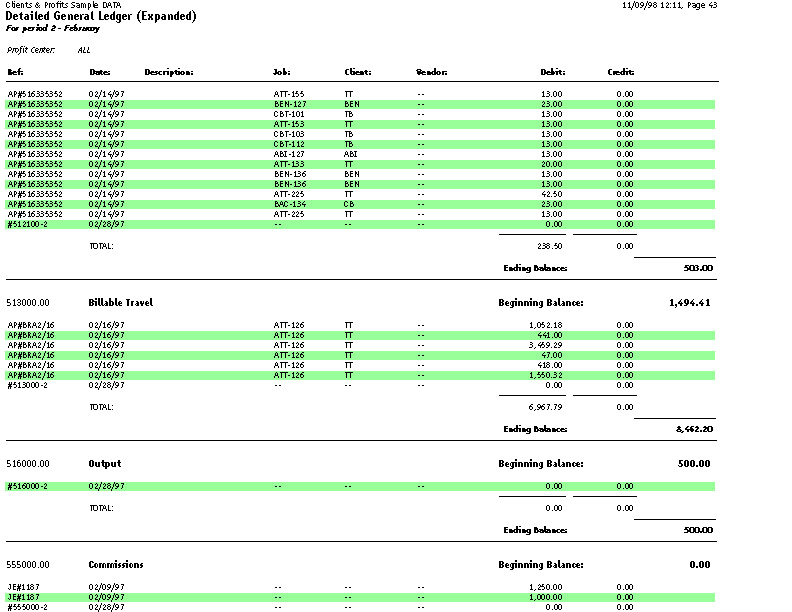
The Detailed G/L (expanded) report shows all the information on the Detailed G/L along with each journal entry’s job, client, and vendor information. |
|
Income Statement |
|
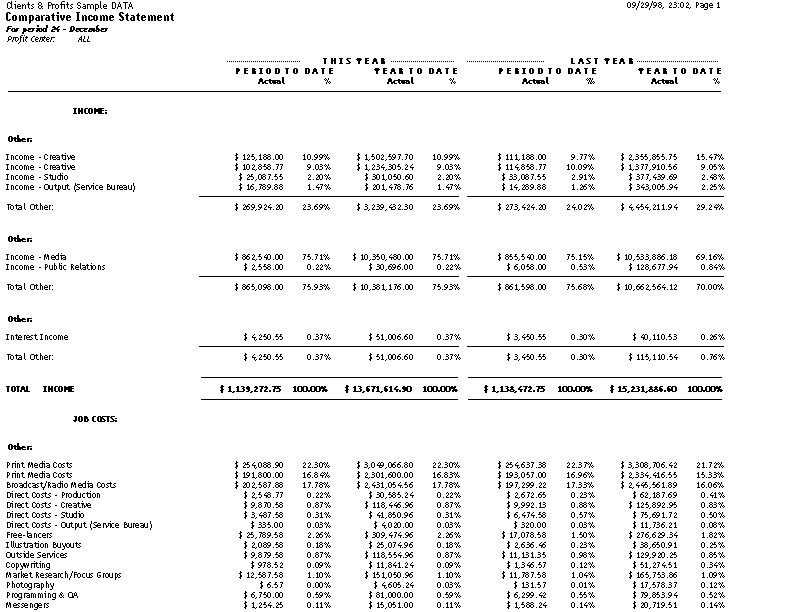
The Income Statement shows income, job cost, and expense accounts as well as net profit/loss for the shop. The standard format shows gross profit as billings less job costs. It also shows expense ratios as part of total billings. The AGI format shows expense ratios as part of gross profit, not total billings. |
|
The Comparative Income Statement compares this years income, job cost, and expense accounts to the amounts from last year. |
|
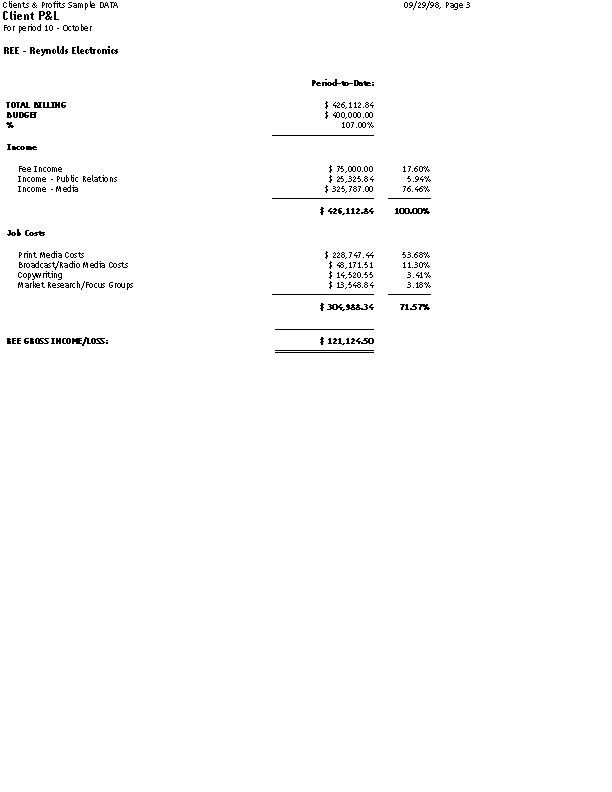
The Client P&L report shows billings, direct costs, gross profit, and gross profit by client. Unlike the Client P&L Analysis, it does not break out each client’s share of overhead. |
|
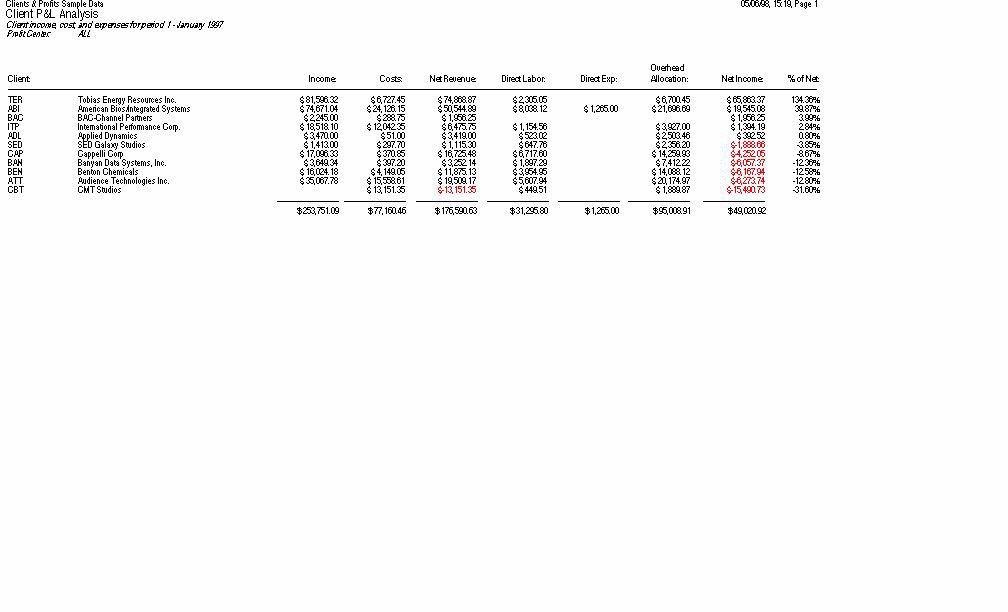
The Client P&L Analysis shows each client’s income, costs, direct labor, direct expenses, plus their share of the overhead allocation. The net income earned is calculated by client. Costs come from all posted costs to the jobs (all A/P invoices and Job Cost checks). Direct labor amounts pull directly from the Overhead Allocation Worksheet (not available in C&P X Classic). |
|
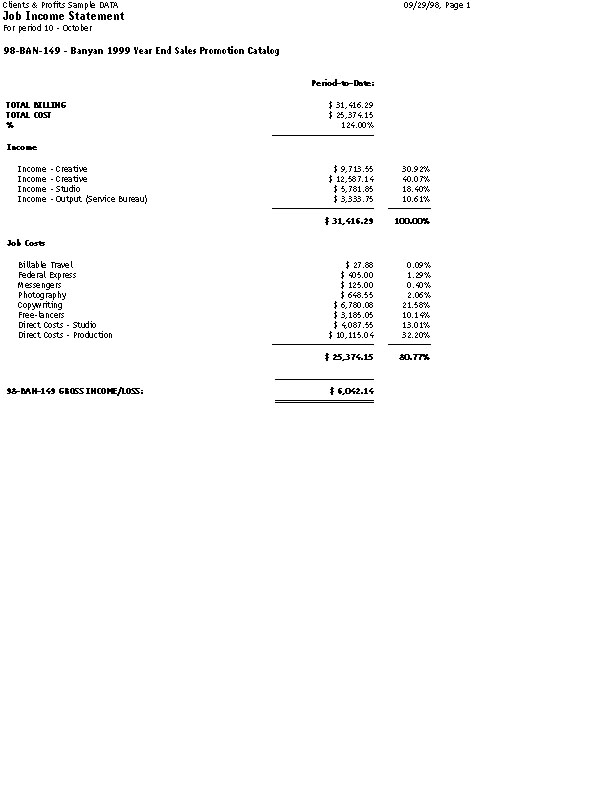
The Job P&L shows billing, direct costs, expenses, and gross margin for one period. |
|
Balance Sheet |
|
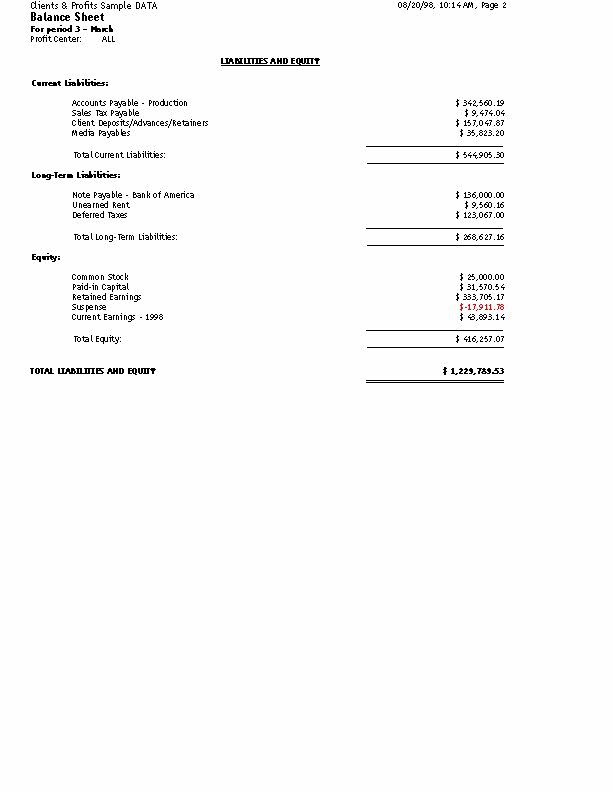
The Balance Sheet shows ending balances for assets, liabilities, and equity. It shows your net worth. |
|
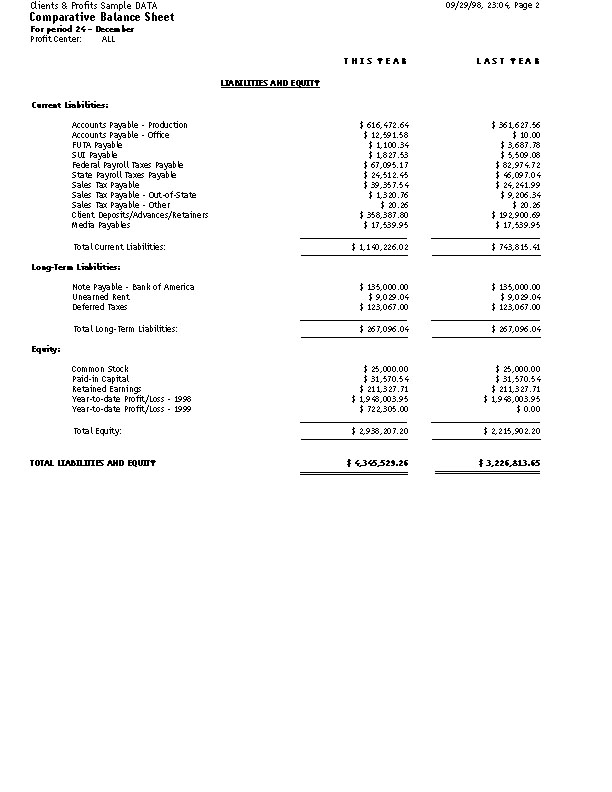
The Comparative Balance Sheet compares assets, liabilities, and equity between two fiscal years. |
|
Budgets |
|
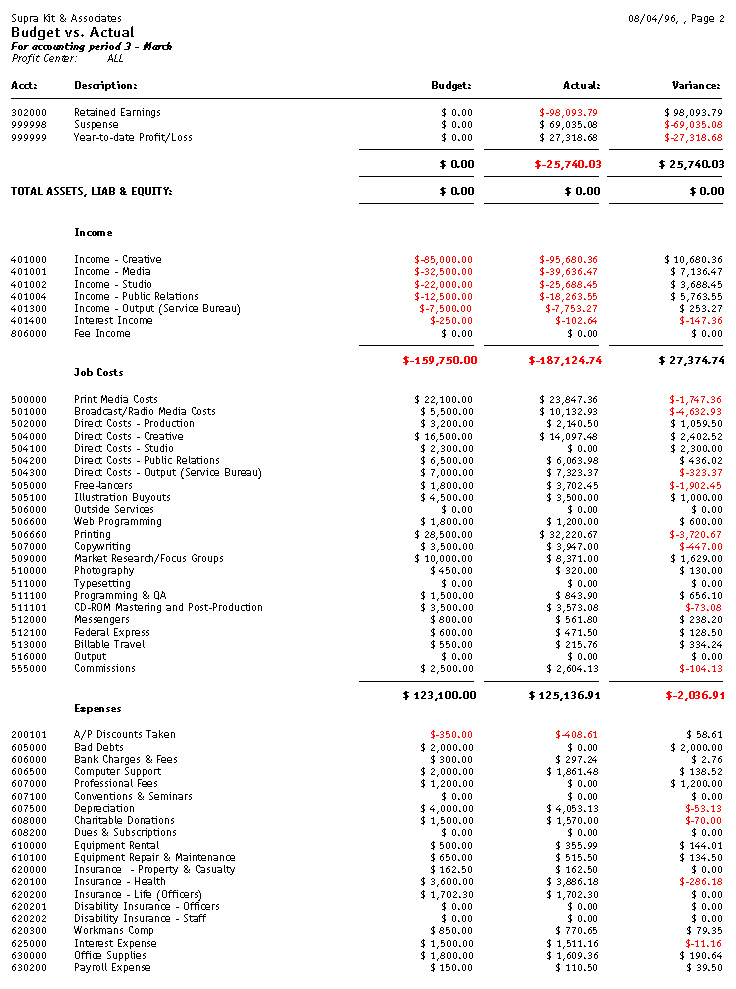
The Budget vs. Actual report compares each G/L account’s budget with its current balance. Budgets are entered for each account in the Chart of Accounts. You’ll have the option to compare month-to-date and year-to-date totals, including percentage variances. |
|
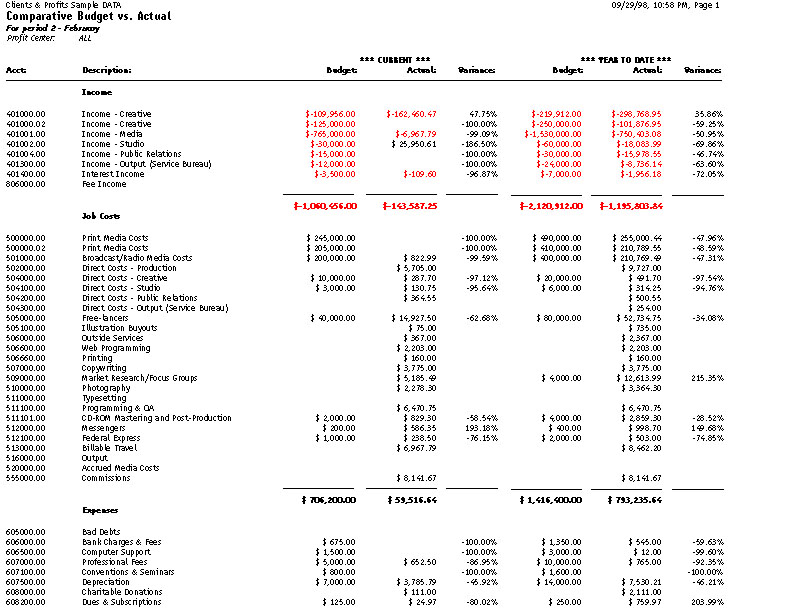
The Comparative Budget vs. Actual report compares G/L account budgets with actuals for the current period and the year-to-date. |
|
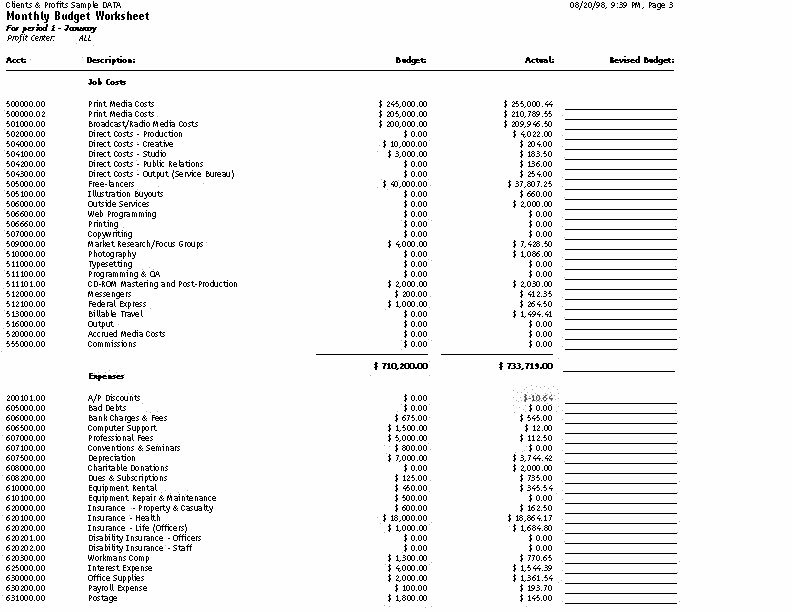
The Monthly Budget Worksheet lists G/L accounts with the current month’s budget. An extra column is included to make manual revisions, which would be entered later into the Budget Worksheet window. |
|
The YTD Budget Worksheet lists G/L accounts and their year-to-date budgets, plus an extra column for making revisions to the budget amounts. |
|
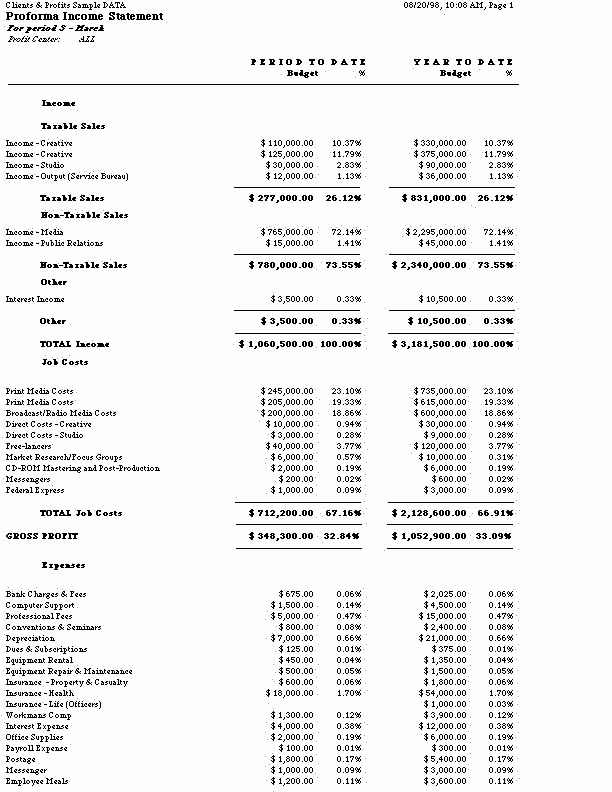
The Proforma Income Statement projects the shop’s income using the period’s budgets. |
|
Analysis |
|
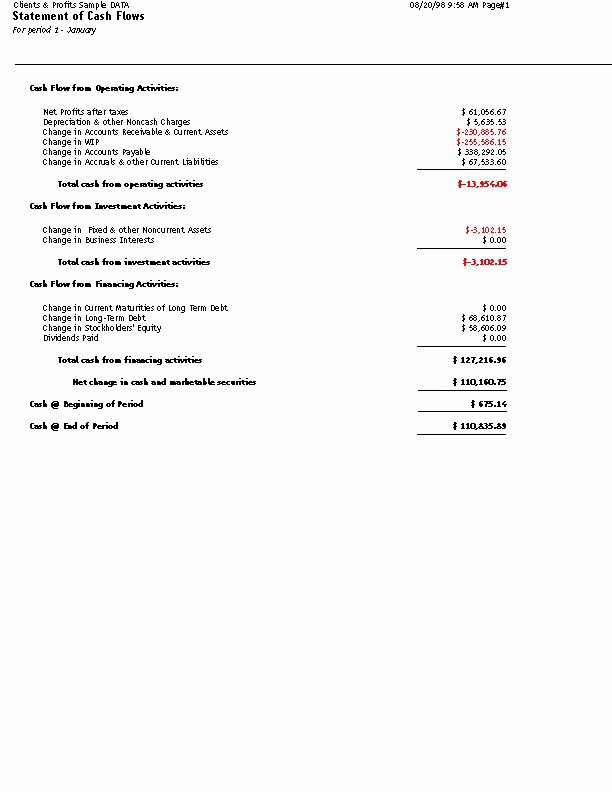
The Statement of Cash Flows report uses each G/L account’s cash flow category to calculate operating, investing, and financial activities totals for the period. |
|
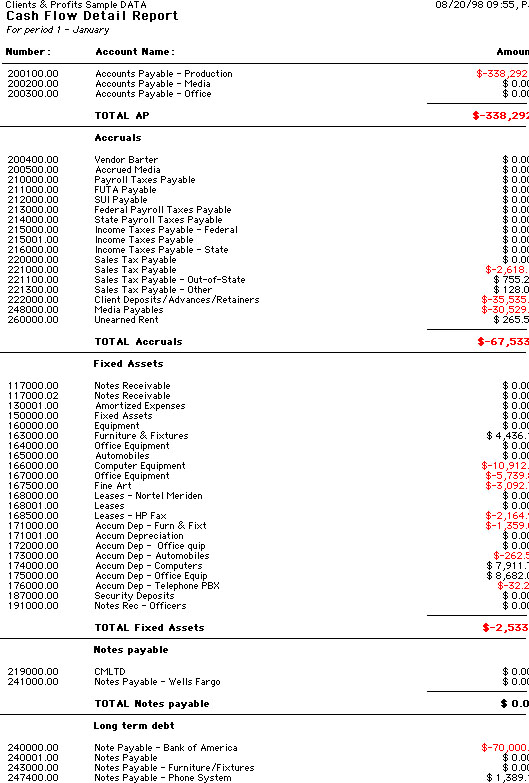
This report shows detail of the amounts on the Statement of Cash Flows. It is used to analyze the amounts use to calculate the totals shown on the Statement of Cash Flows. |
|
Media WIP Analysis |
The Media WIP Analysis report is used to audit balance of the Media WIP Accruals liability account, which is updated from media billing and vendor invoices. |
Ratios |
|
The Liquidity Analysis report measures the ability of the company to meet cash requirements. It’s based on the ratio categories entered for each G/L account. |
|
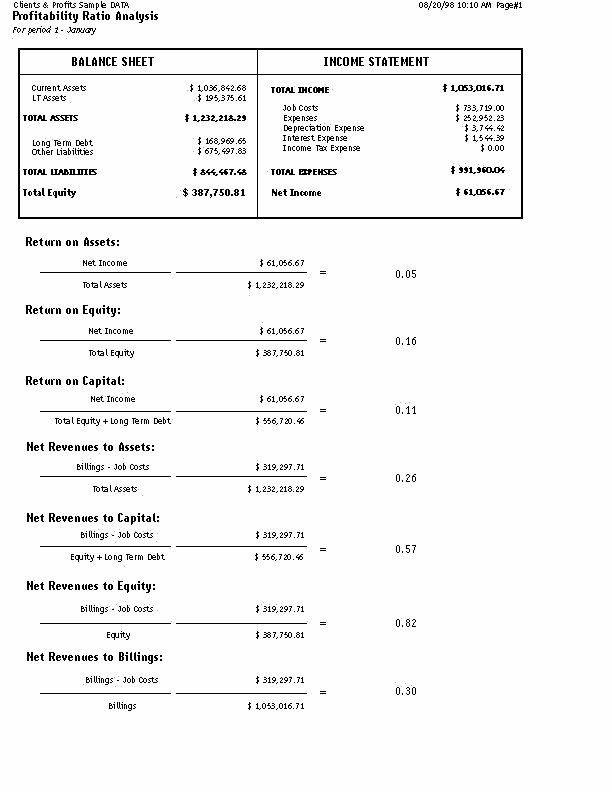
The Profitability Analysis report measures how well the company is utilizing its resources |
|
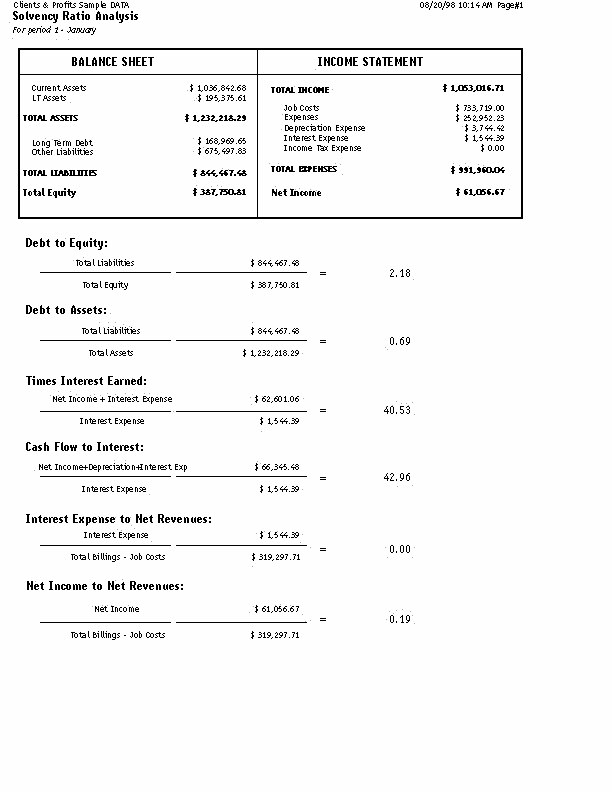
The Solvency Analysis report measures how the company’s financial health with ratios such as debt-to-equity, cash flow to interest, debt-to-assets, and more. |
|